
SOLUTIONS | Recruiting
Streamline Recruiting
The employee lifecycle starts with recruiting. Sync your HRIS, ATS, background check, e-signature, databases, and dashboards to streamline your processes and surface meaningful insights across the business. Powered by Snaplogic, the most powerful Integration Platform as a Service (iPaaS) technology on the market!

recruiting | Dashboard #1
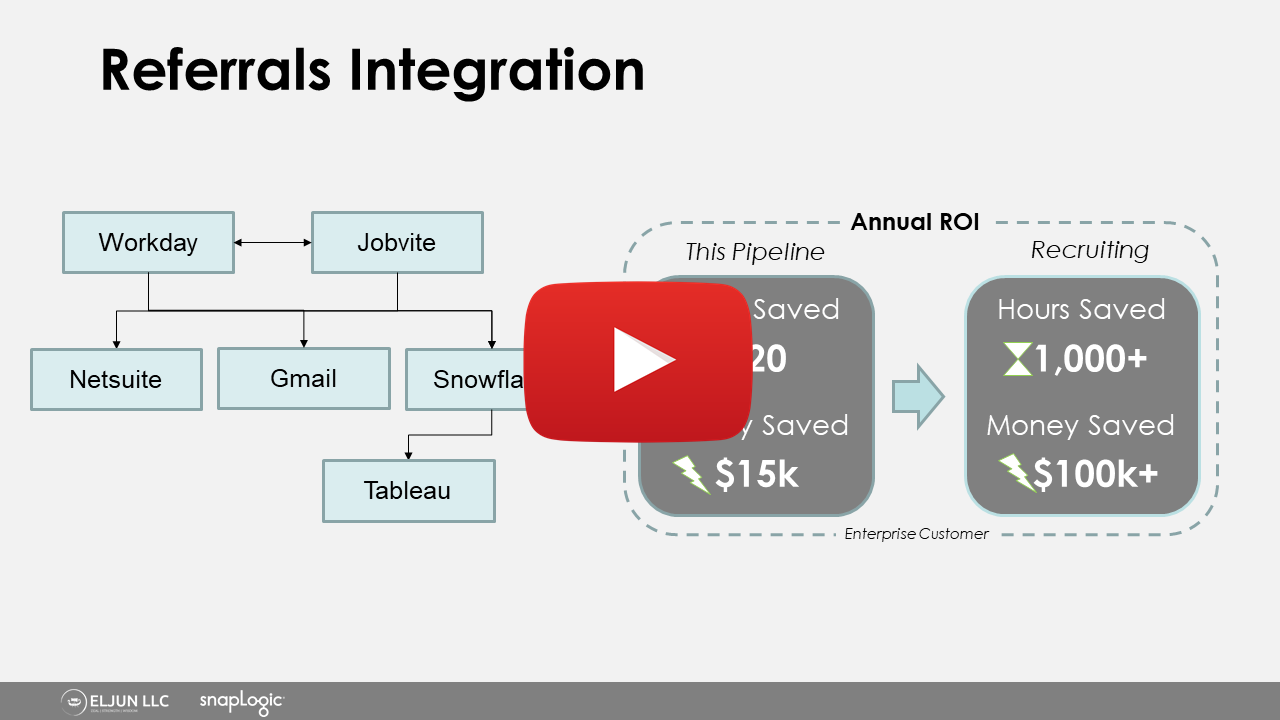
Referral Program Automation
This dashboard sample pulls data from the Applicant Tracking System (ATS), Human Resources Information System (HRIS), and Performance Management software to provide a quick, holistic view of a referral program costs and benefits. Note that this sample is just the tip of the iceberg! We can add other metrics to more fully round out the view, such as:
- Diversity and Inclusion comparisons
- Time-to-Fill data (cost of talent acquisition)
- Retention comparisons (cost/ROI of retention)
- Employee output or revenue contribution (value of output)
At a glance, we see the total spend for our referral program. We also see the breakout by geographic area and organizational unit.
We can quickly identify our MVPs for the program by looking at the leaderboard. These are individuals we should recognize, and perhaps interview, to learn about their sourcing tactics.
Metrics are readily available to justify program expenditure and show ROI. The promotion rates and review score comparisons clearly show that referrals strongly outperform their non-referred peers.
Recruiting | Dashboard #2
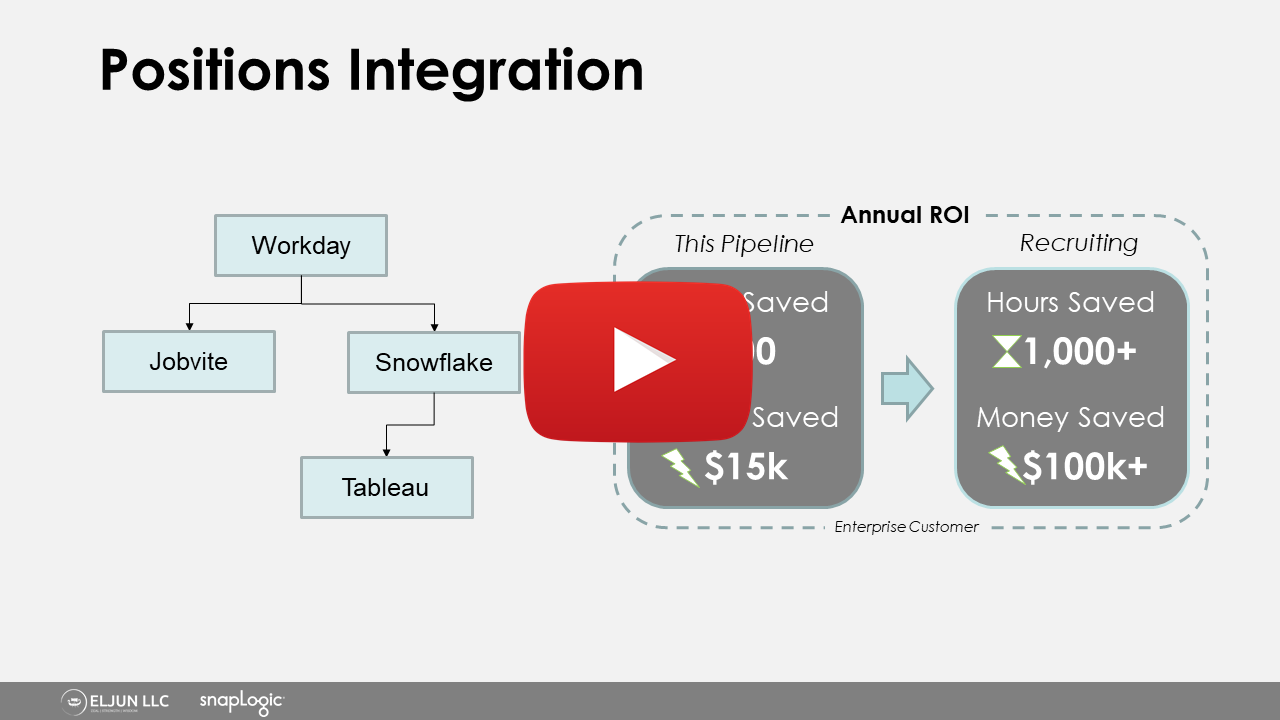
Positions Integration: ATS + HRIS
This dashboard sample provides a snapshot of the overall funnel health, open positions, and cost in dollars to fill positions. Note that this sample is just the tip of the iceberg! We can add other metrics to more fully round out the view, such as:
- Total position forecasting
- Histogram with trended data
- Factors driving costs and opportunities to streamline
- Direct links to the positions themselves
The top line numbers let us quickly understand the average length of each step in the Talent Acquisition pipeline. We also see that our total time is ~53 days, setting a baseline for workforce planning, backfill forecasting, and other activities.
The open positions table shows us the roles our Recruiting team is currently working to fill. Note that the projected hire date uses historical data by individual role to generate a more accurate forecast.
The bottom charts show us the average time-to-fill vs. cost-to-fill over time. In this case, referrals are faster and cheaper to hire than their non-referred peers.
The bottom-left chart also shows that while costs and time-to-fill duration largely correlate, this relationship changes dramatically at time-to-fill of ~40 days. Costs may be rising due a systemic burden, such as increased labor expenses due to overtime. We should investigate this observation further, as it may surface opportunities to boost efficiency.